
The first twenty minutes of an investigation disappear
Asset, vulnerability, identity and file-integrity context resolving to the same identity removes the pivoting that consumes the opening of every investigation in a multi-tool stack.
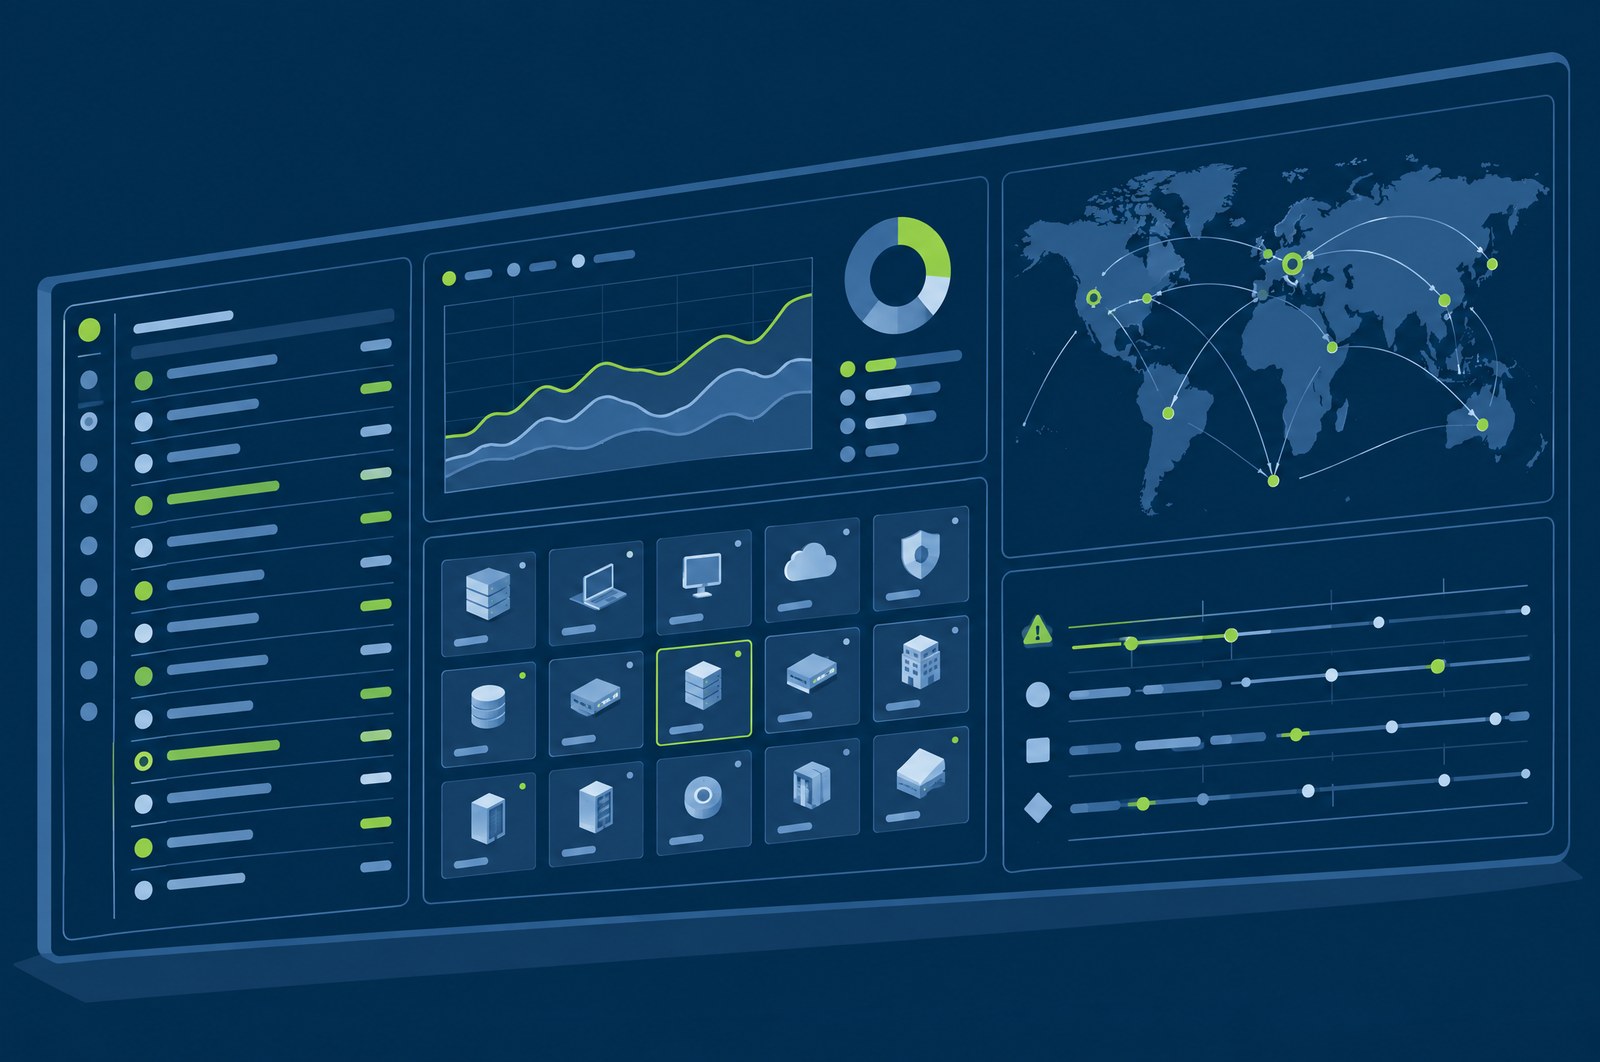
Everything in one command center.
Analyst, administrator and client-portal views live in the same console. An analyst investigating one alert does not open six interfaces to gather context.
What is at stake
Cross-tool correlation does not disappear when nobody has time for it — it simply stops happening, silently, exactly when volume is highest.
Asset, vulnerability, identity and file-integrity context resolving to the same identity removes the pivoting that consumes the opening of every investigation in a multi-tool stack.
One interface to learn instead of six shortens onboarding and reduces how much capability walks out when an experienced analyst leaves.
For service providers, a customer-facing view scoped to their own tenant is something to sell and show, not a report assembled by hand each month.
Who carries this
The SOC lead day to day. For service providers the client portal is frequently what is demonstrated in the sales meeting.
The problem
Most security stacks are assembled rather than designed. Endpoint came from one vendor, the SIEM from another, vulnerability management from a third, identity from a fourth, and each arrived with its own console, its own severity vocabulary and its own notion of what an asset is.
The cost is paid during triage, by the analyst, in the least forgiving conditions. They see an alert in one tool, look up the asset in a second, check its vulnerabilities in a third, correlate the identity activity in a fourth, and act in a fifth. That correlation is being done by a human, from memory, under time pressure— which means it is slow, inconsistent between analysts, and the first thing to go when volume rises.
It is also the step where a platform’s unification claim is really tested. A product suite that shares a vendor but not a console has moved the integration problem to procurement rather than solving it.
Cross-tool correlation does not disappear when nobody has time for it. It just stops happening.
The console areas
Overview, threat map, risk posture, tenant fleet and business-unit summary — the view that answers "what is happening right now" without drilling anywhere.
Alerts inbox, investigations and cases, threat hunting, the MITRE ATT&CK view, event timeline and the Malware Center.
Overview, incident queue, alert explanations, approval center, knowledge base, and feedback and learning.
Dedicated ITDR and AIDR consoles, so identity and GenAI findings have their own working surface rather than being folded into generic alert noise.
Inventory, agents, groups, software, network, profiles and telemetry, alongside CVEs by asset and remediation views.
Coverage, integrations and policies, source parsing, rule performance, custom detections and rule testing — so tuning is console work rather than a code deployment.
Compliance posture, evidence and reports; file integrity changes and baseline; the report center with generated and scheduled reports.
A customer-facing view of their own dashboard, incidents, assets, threat map, vulnerabilities, compliance, service, support and reports — scoped to their tenant.
Users and roles, RBAC policies, API console, audit log and settings.
How it fits the platform
One console is the reason the unified-stack claim holds up operationally. Separate tools for each capability means manual correlation across interfaces, which is slow, inconsistent between analysts, and the first thing dropped when alert volume rises.
How it works
The sequence below is the entire argument for a single console, expressed as the path an analyst takes through it.
Already carrying its severity band from the shared scale, its ATT&CK technique and tactic, and whatever threat-intelligence context was attached at detection time.
Inventory, agent status, installed software, open vulnerabilities and recent file integrity changes are all for the same asset identity. In a multi-tool stack this is where the first twenty minutes go.
Event timeline and the correlated incident show what happened either side of the alert — which is usually the question that decides whether this is an incident or a false positive.
A plain-language explanation sits on the alert, produced by the on-premises AI service. It is context, not a verdict, and the alert reached the inbox whether or not the AI service ran.
Isolate, block, disable, kill or quarantine — through the approval center where a gate applies. The analyst does not change tools to act on what they just concluded.
Investigations and cases hold the work, and the audit log holds who did what. Both feed the evidence library that the compliance module draws on.
By role
The console serves six distinct working patterns. Knowing which areas are yours is the fastest way to judge whether it fits your team.
Properties
Analyst, administrator and client-portal views are the same console scoped differently. An MSP operator, their engineer and their customer are all served without standing up anything additional.
Detection Engineering is a console area, not a repository. Custom rules are authored, tested and measured for performance in the interface and apply to live telemetry immediately.
What a user sees is bounded by their tenant at the data layer, so the client portal is safe to hand to a customer. Scoping is not a view filter.
Every capability on these product pages is a console area. If an evaluation is going to turn on anything, it should turn on a walkthrough of this rather than on a feature list.
Background
Plain explainers on the underlying ideas, written for someone evaluating rather than buying.
Questions
One. Analyst, administrator and client-portal views live in the same XDR Command Center, which is what avoids the usual situation of an analyst opening six interfaces to gather context on one alert.
Yes, through the client portal: their dashboard, incidents, assets, threat map, vulnerabilities, compliance, service, support and reports — scoped to their tenant.
From the console. The detection engineering area covers coverage, integrations and policies, source parsers, rule performance, custom detections and rule testing, so tuning does not require a code deployment.
Works with
Every module runs in the same self-hosted stack and shares the same telemetry, severity model and response engine.
An on-prem AI analyst that triages, correlates and explains — using a local LLM, so your data never leaves your network.
ExploreTurn raw events into severity-graded, ATT&CK-mapped alerts — then connect them into real attacks.
ExploreOne platform, many customers, complete isolation.
ExploreWe will walk through the console, the deployment model and what it takes to stand it up in your environment.