SOC 2 Readiness
24/7 Security Monitoring
Canadian-Based SOC
GuardsArm Platform · Detect

XDR — Detection & Correlation

Turn raw events into severity-graded, ATT&CK-mapped alerts — then connect them into real attacks.

The detection engine promotes events to findings, grades them on one severity scale, maps them to MITRE ATT&CK, and correlates sequences into incidents. Detection runs on a roughly 60-second cycle.

  • ~60-second detection cycle
  • 600+ ATT&CK techniques
  • Console-authored rules
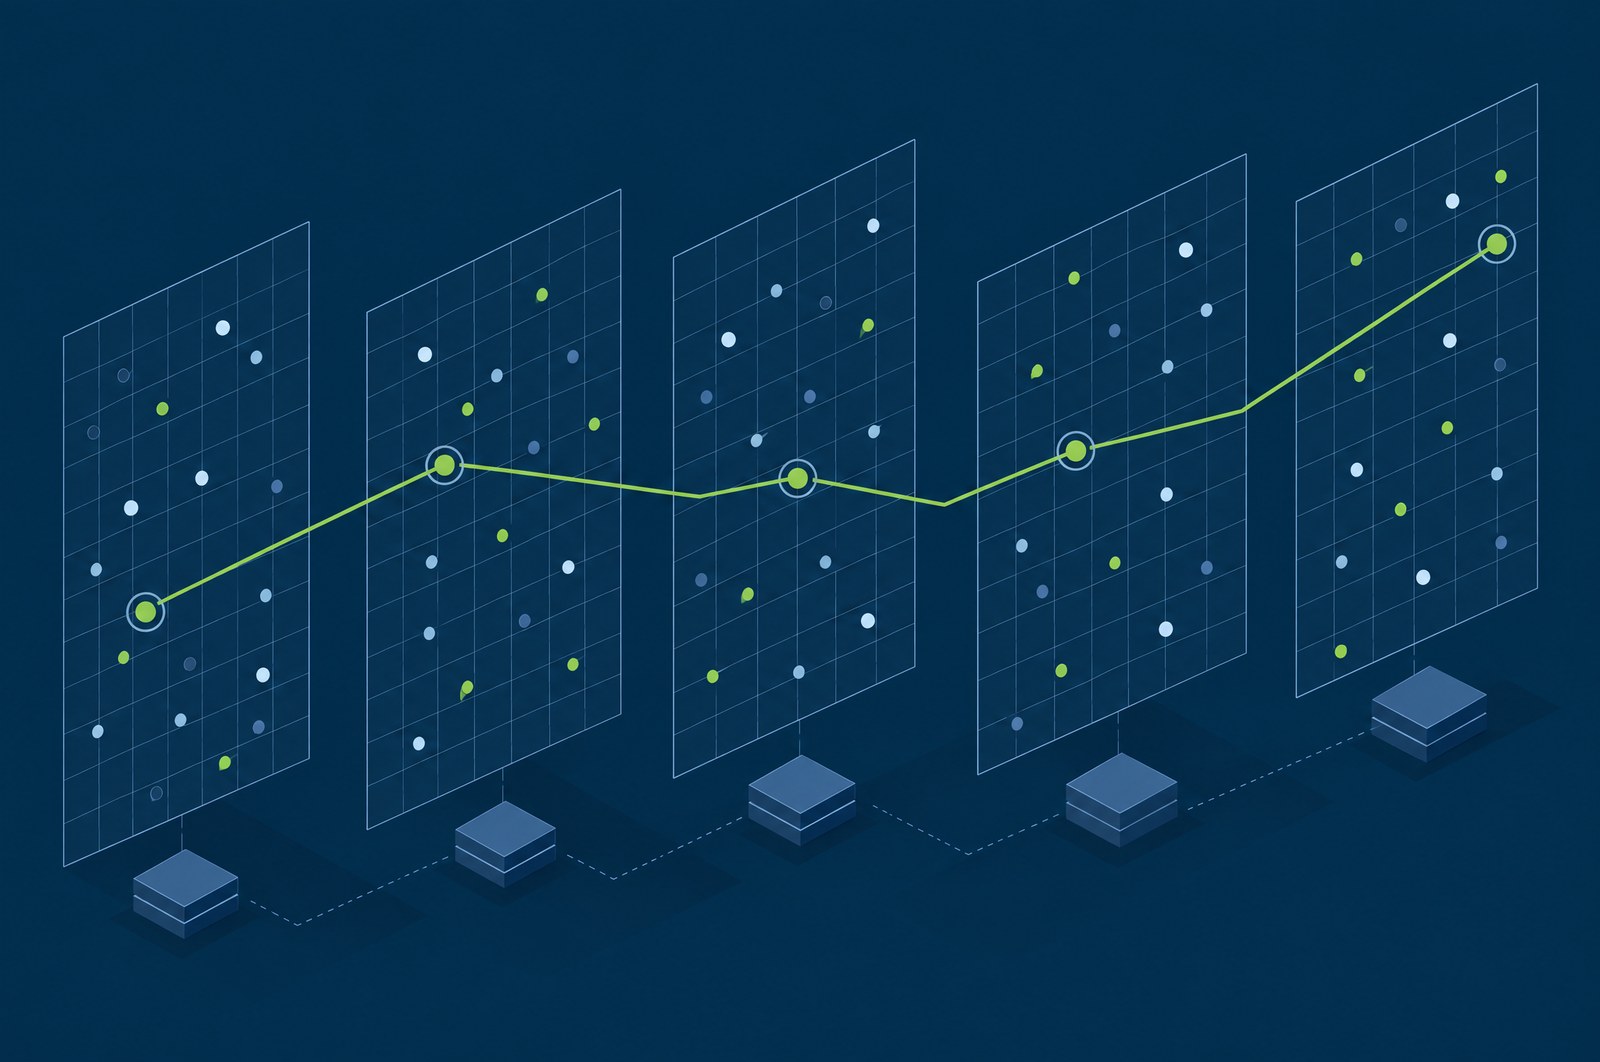
Individual security events being graded by severity, mapped to MITRE ATT&CK techniques and assembled into a single correlated incident

What is at stake

Analysts spend their shift on a queue they cannot rank, while the sequence that constitutes a real attack arrives as unrelated fragments.

A queue that can actually be sorted

One severity scale across every module means highest-first is a meaningful instruction. Where each source grades on its own terms, analysts fall back on which tool they personally trust — and that knowledge leaves when they do.

Attacks surface as incidents, not as five dismissible alerts

Correlation assembles the sequence while it is still in progress. The alternative is reconstructing it afterwards in an incident review, which is the same work done too late.

Coverage you can show rather than assert

ATT&CK mapping carried on the findings themselves makes "what are we covered for" answerable from the platform, which is the form that question takes when it comes from a board or an insurer.

Who carries this

The SOC lead runs it; the coverage view is what gets taken into board and cyber-insurance conversations.

The problem

Alert volume is not the problem. Alert meaning is.

Every detection product produces more alerts than a team can read. The usual response is to tune aggressively, which trades false positives for false negatives, or to add a triage layer, which adds latency. Neither addresses why the alerts were hard to read in the first place.

Two causes dominate. The first is inconsistent severity: when the endpoint module, the identity module and the vulnerability scanner each define “high” on their own terms, the queue cannot be sorted. Analysts learn which sources to believe, and that institutional knowledge leaves when they do.

The second is missing sequence. An attack is a chain, but most tools alert on links. Five medium-severity findings that together describe an intrusion arrive as five medium-severity findings, each individually dismissible, and the reconstruction happens afterwards in an incident review.

A severity that means something different depending on which module raised it is not a severity. It is a label.

Capabilities

What the detection engine does

Rules-as-data promotion tier

Around 90 security-relevant event types are mapped to a severity level, a MITRE technique and compliance tags, then promoted to findings. This is the cross-OS layer that turns events into alerts.

30+ behavioural analytics

Brute-force logon, credential dumping (T1003), process injection and hollowing (T1055), persistence via registry Run keys, startup folder, services and scheduled tasks, LOLBin execution and C2 egress, obfuscated PowerShell, suspicious process ancestry, account manipulation, alternate data streams, malicious named pipes, DGA-style DNS, indicator removal, and Linux command-line threats including reverse shells and ransomware-grade impact.

One severity model, everywhere

Every detection derives severity from a single 0–15 scale mapped to Info, Low, Medium, High and Critical, plus a 0–100 risk score. One source of truth means severity means the same thing in the alert inbox, the incident, the report and the API.

Full MITRE ATT&CK mapping

Findings carry technique IDs enriched with technique names and tactics from a complete enterprise ATT&CK knowledge base — 600+ techniques across 14 tactics.

Custom rules without a deploy

Analysts author detection rules in the console: match on event fields, set optional frequency thresholds, choose severity and ATT&CK mapping. Rules apply to live telemetry automatically.

Multi-stage correlation into incidents

Correlation families build incidents from sequences across time and data domains — brute force into successful login, execution into persistence, exploitation of a confirmed-vulnerable host, credential access into lateral movement, defences impaired then follow-on action, privilege escalation into entrenchment, and ransomware impact clustered in a short window.

How it fits the platform

Incidents inherit their severity and feed both the console and the automated response engine, so a correlated attack can trigger containment in the same cycle it was assembled in.

How it works

One detection cycle, start to finish

This runs roughly every sixty seconds, continuously, on your own hardware.

  1. Events arrive and are promoted

    The rules-as-data tier maps roughly 90 security-relevant event types to a severity level, a MITRE technique and compliance tags, then promotes them to findings. This is the cross-OS layer: one mapping covers Windows, Linux and cloud sources rather than three parallel rule sets.

  2. Behavioural analytics run

    More than thirty analytics evaluate patterns the promotion tier cannot see from a single event — ancestry, frequency, sequence and command-line shape. These produce findings in their own right.

  3. Severity is assigned from one scale

    Every detection derives its severity from a single 0–15 level mapped to a consistent band, plus a 0–100 risk score. There is one source of truth, so a High from the endpoint module and a High from identity mean the same thing.

  4. ATT&CK enrichment is attached

    Technique IDs are enriched with technique names and tactics from a complete enterprise ATT&CK knowledge base — 600+ techniques across 14 tactics — so coverage analysis is a property of the data rather than a spreadsheet somebody maintains.

  5. Correlation assembles incidents

    Multi-stage families look across time and across data domains for sequences that constitute an attack. Incidents inherit severity from their constituent findings.

  6. The cycle closes in about sixty seconds

    A finding written in one detection cycle can correlate, notify and trigger response inside the same tick. Detect-to-respond latency is measured in seconds rather than in polling intervals.

Severity

One scale, used by every module

A 0–15 level maps to five bands and a 0–100 risk score. Nothing on the platform defines its own.

BandUnderlying levelWhat it means in practice
CriticalLevel 13–15Confirmed compromise or active impact. Response fires, subject to approval policy.
HighLevel 10–12Strong attacker signal — credential access, persistence, defence evasion.
MediumLevel 7–9Suspicious but not conclusive on its own. Prime correlation material.
LowLevel 4–6Policy and hygiene findings. Useful in aggregate, not individually alarming.
InfoLevel 0–3Recorded for context and compliance evidence; does not raise an alert.

Because the scale is shared, queue sorting, escalation policy and response thresholds can all be expressed once and applied platform-wide.

Correlation

The multi-stage sequences that build incidents

Named families rather than a generic promise. Each looks for a specific progression across time and across data domains.

  • Brute-force attempts, then a successful loginCredential compromise incident — the one alert pair that matters out of thousands of failed logons.
  • Execution, then persistence on the same hostFoothold established. The sequence is the signal; either half alone is routine.
  • Exploit attempt against a confirmed-vulnerable hostExposure joined to attack. Vulnerability findings and detections share asset identity, so this is a join rather than an inference.
  • A known-exploited vulnerability present and reachablePrioritised exposure incident, raised before anything has happened to it.
  • Credential access, then lateral movementAttacker expansion — the point at which containment scope changes from one host to several.
  • Defences impaired, then a follow-on actionDeliberate evasion. Tampering alone is suspicious; tampering followed by activity is not ambiguous.
  • Privilege escalation, then entrenchmentEscalation incident, typically the last quiet step before impact.
  • Multiple impact techniques in a short windowRansomware incident. Handled as its own family because the response has to be immediate.

Behavioural coverage

What the analytics look for

More than thirty behavioural detections, grouped by the ATT&CK tactic they serve.

Credential access

  • Brute-force logon
  • LSASS dumping (T1003)
  • Account manipulation
  • Backdoor accounts

Execution & evasion

  • Process injection (T1055)
  • Process hollowing
  • LOLBin execution
  • Obfuscated PowerShell
  • Office → shell ancestry
  • Alternate data streams

Persistence

  • Registry Run keys
  • Startup folder
  • Services
  • Scheduled tasks

Command & control

  • C2 egress
  • DGA-style DNS
  • Malicious named pipes

Anti-forensics

  • Indicator removal
  • Log clearing
  • Defence impairment

Linux & macOS

  • Reverse shells
  • Defence evasion
  • Ransomware-grade impact

Beyond these, analysts author custom rules directly in the console — matching on event fields with optional frequency thresholds, choosing severity and ATT&CK mapping. New rules apply to live telemetry immediately; there is no code deploy and no release to wait for.

Background

Understand the concept first

Plain explainers on the underlying ideas, written for someone evaluating rather than buying.

Questions

Common questions

Can our analysts write their own detection rules?

Yes, in the console. A rule matches on event fields with optional frequency thresholds, and the analyst sets its severity and ATT&CK mapping. Rules apply to live telemetry automatically, with no code deployment.

How quickly does a detection turn into a response?

Detection runs on a roughly 60-second cycle, and a finding written in one cycle can correlate, notify and trigger a response within the same cycle.

What stops severity meaning different things in different places?

Every detection derives severity from one 0–15 scale mapped to Info, Low, Medium, High and Critical, plus a 0–100 risk score. A single source of truth means the severity in the alert inbox is the severity in the incident, the report and the API.

Is ATT&CK coverage just technique IDs on an alert?

Findings carry technique IDs enriched with technique names and tactics from a complete enterprise ATT&CK knowledge base — 600+ techniques across 14 tactics — so coverage can be assessed at technique level rather than asserted at tactic level.

See XDR running on your own infrastructure

We will walk through the console, the deployment model and what it takes to stand it up in your environment.