You know what you would miss
Coverage built from live data and laid over ATT&CK shows the gaps as gaps.

See what you actually detect, write the rule you are missing, and test it before it runs.
Detection content is only as good as the telemetry behind it. The Detection Engineering area starts from what is arriving and firing in your deployment, and gives analysts the tools to close the gaps they find.
What is at stake
Detection that is never measured decays: sources go quiet, rules get noisy, and nobody notices until an incident review.
Coverage built from live data and laid over ATT&CK shows the gaps as gaps.
Writing, testing and tuning a rule happens in the console, without waiting on a vendor content release.
False-positive feedback goes back into tuning, so the queue improves with use.
Who carries this
Carried by the detection lead or senior analysts. The measure they answer for is whether coverage is known and improving.
The problem
It is easy to count rules and hard to know what they catch. A rule for a log source you do not collect detects nothing. A rule that fires five hundred times a day is ignored. Neither shows up in a rule count.
Coverage is a property of your deployment: the telemetry that is arriving, the detections that are firing against it, and the techniques left with nothing watching them. That picture changes every time a source is added or a rule is tuned.
Detection Engineering starts from that picture and puts the authoring, testing and tuning tools next to it.
The useful question is not how many rules you have. It is which technique would go unnoticed tonight.
Capabilities
Coverage is built from the sources and detections observed in your deployment, so it shows what you actually detect today.
Analysts write their own severity-graded rules, with optional frequency thresholds and ATT&CK mapping. Rules apply to live telemetry and their findings appear in the analyst queue.
Detection content is organised into policies for applications, cloud and SaaS, endpoints and network security, with per-source content you can switch on or off.
Add parsing for a log source that is specific to your environment. New content is validated before it goes live.
A dedicated Test Rule screen lets a rule be checked before it is trusted with production alerts.
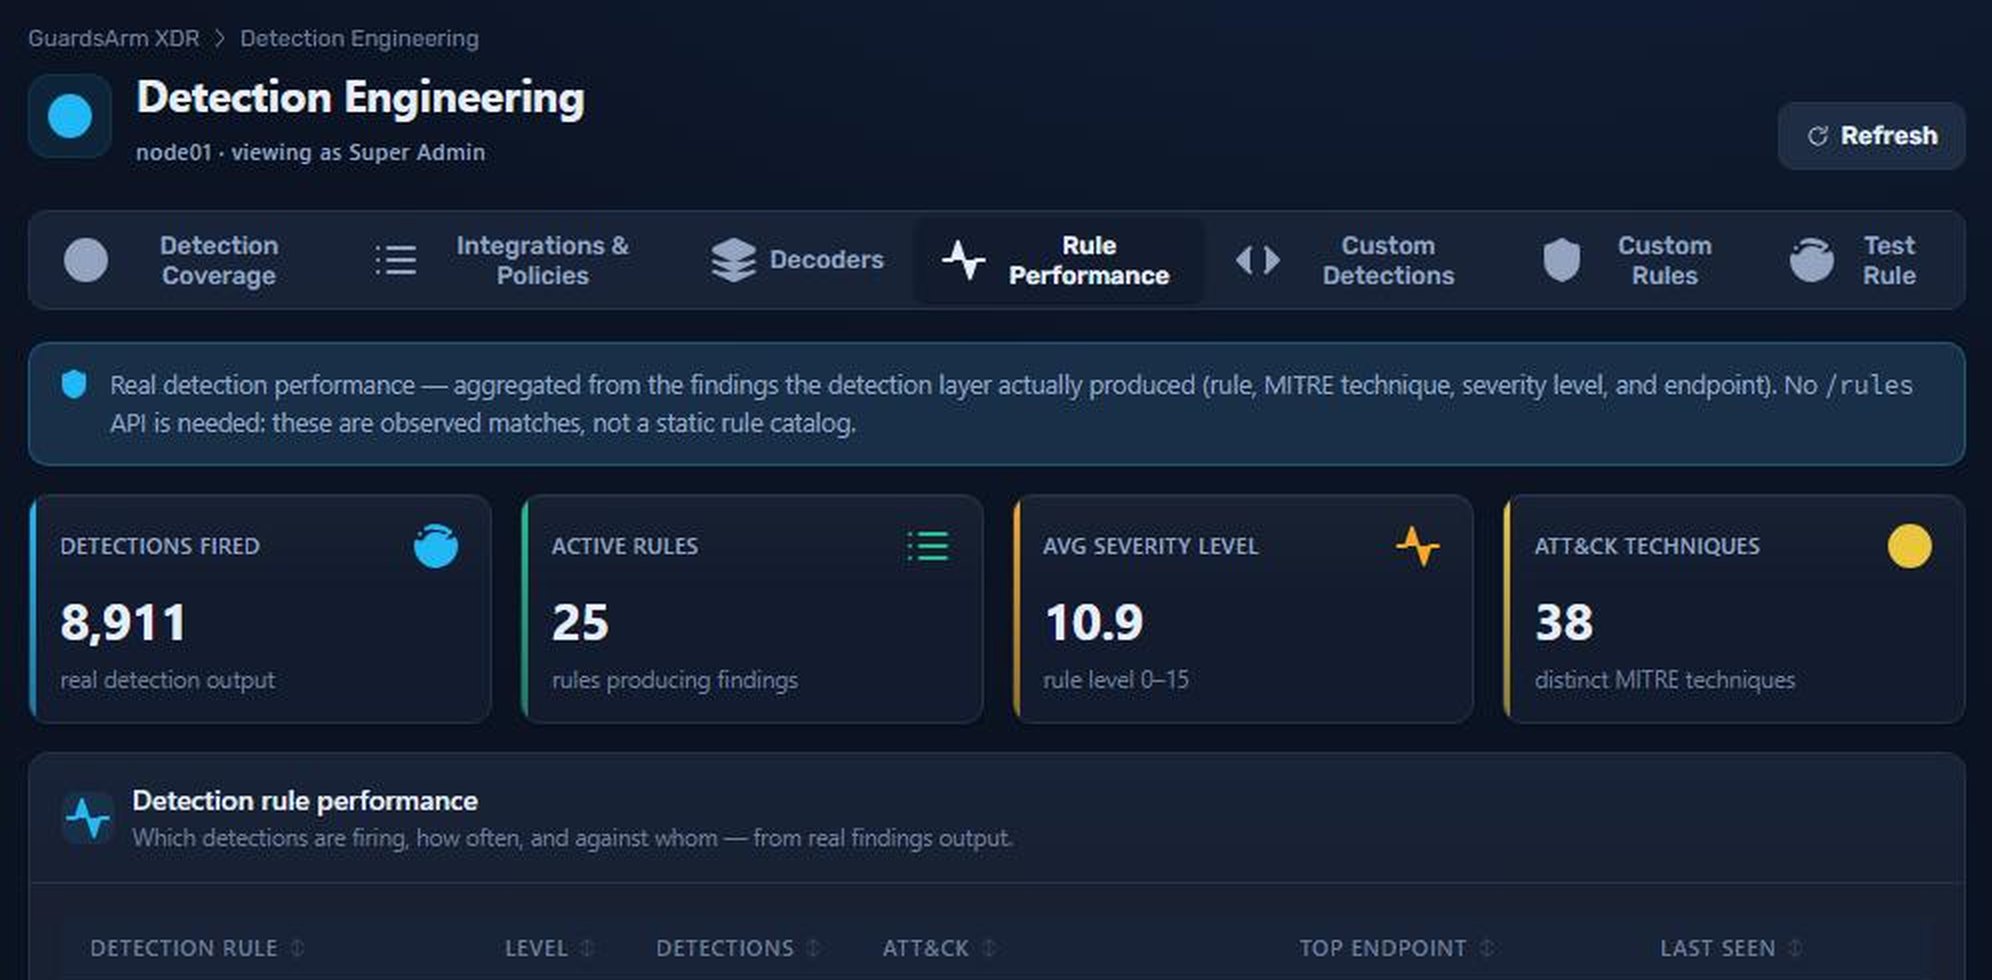
See which detections are firing, how often, at what severity and against which endpoints, measured from actual findings.
GuardsArm AI can analyse rule volumes together with analyst false-positive feedback to surface noisy rules, suggested tuning, draft detections and missing telemetry. Drafts require human review before deployment.
The MITRE ATT&CK view lays coverage over the full Enterprise matrix and marks each technique as firing, covered by a detection, covered by a saved hunt, or a gap. Layers can be exported and imported.
How it fits the platform
Coverage, authoring, testing and tuning sit in the same console as the alerts they produce, so the person who sees a miss in an investigation is a few clicks from the rule that would have caught it.
How it works
How detection content improves over time.
Coverage and the ATT&CK matrix show which sources are quiet and which techniques have no detection or hunt behind them.
An analyst authors a custom rule or detection in the console.
The rule is checked on the Test Rule screen before it is trusted.
Rule performance shows whether the rule is useful or noisy once real telemetry reaches it.
Analyst false-positive feedback and rule volumes feed the AI tuning analysis, which proposes changes and draft detections for a person to review.
Questions
Yes. Custom detections and custom rules are authored in the console, and there is a Test Rule screen for checking a rule before it produces live alerts.
No. It is derived from the detection sources and findings observed in your ingested data. It shows what is producing events and detections in your deployment, which is a more honest measure than a catalog size.
No. The AI tuning analysis produces recommendations and draft detections from rule volumes and analyst false-positive feedback. Drafts require human review before deployment.
Works with
Every module runs in the same self-hosted stack and shares the same telemetry, severity model and response engine.
Turn raw events into severity-graded, ATT&CK-mapped alerts — then connect them into real attacks.
ExploreOne workspace for the alert queue, investigations, hunting and the timeline behind them.
ExploreAn on-prem AI analyst that triages, correlates and explains — using a local LLM, so your data never leaves your network.
ExploreWe will walk through the console, the deployment model and what it takes to stand it up in your environment.